Dashboard for social care service management

 As an integrated care provider, BSA manages the “El Carme” center, which currently has 209 beds distributed in different services: long stay, convalescence, subacute and palliative care. The project “Dashboard for social care service management” arises from the need to have a decision tool that helps monitor the activity, improves the planning of the occupancy and the available resources and allows to measure and follow up indicators related to quality of care.
The areas covered by the dashboard system for social care services management are:
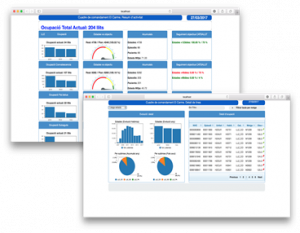
- Activity Monitoring. From different dimensions, it allows analyzing the demand, bed occupancy, the number and duration of the stays, the discharges, and the quantitative objectives established by the CATSALUT.
- Costs and resources use. It allows analyzing the impact on the costs of the redistribution of available vacancies in the different services offered by BSA.
- Quality of care indicators. It enables the follow-up of quality indicators such as improved quality of life, improved pain, nutritional status, etc.
The dashboard combines three different analytical technologies: 1) dashboards, 2) OLAP analysis and 3) analytical models and simulations. The dashboards show information and key performance indicators of the area of interest of the different users of the system. The OLAP front-end allows to produce reports and on demand graphical visualizations over the OLAP cubes while analytical models and simulations enable “what if” analysis.
The analytical models integrated in the dashboard system allow to improve the planning of the available resources (available vacancies in the different services provided) through two predictive models. On the one hand, the occupancy forecast captures the seasonality and trend of occupancy by training a model with available historical information. On the other hand, cost prediction analyzes the cost behavior under different conditions of planning and distribution of the available vacancies in the different services.
The economic management system should ideally enable the allocation of different costs to individual episodes/patients. However, this is not possible in most cases as there is not a direct cost allocation at this level of granularity, resulting in working under average cost assumptions. Our approach uses historical data of occupancy and patient casuistry (as predictive variables) and information on costs incurred (as training response variables) to define a multivariate regression model to obtain the differential cost under different conditions of distribution and planning of available vacancies. In this way, it is possible in a fully interactive mode to integrate simulation, prediction and measurement to optimize the service efficiency while keeping the quality of care indicators under control.
Technology
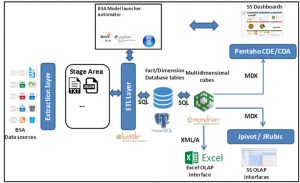
 The dashboard for social care service management uses Kettle as an ETL tool to extract information from data sources (financial economic system and HIS system) and load a relational database in PostgreSQL designed by using the snowflake model. The OLAP engine used is Mondrian and the dashboards are designed with Pentaho-CDE. R has been integrated into the pipeline for the analytical modelling. All these components have been developed to be self-contained in Docker containers to facilitate their interoperability and deployment on the platform.


